(An updated review of more recent data is available at Confined space Fatalities...an updated look at the numbers)
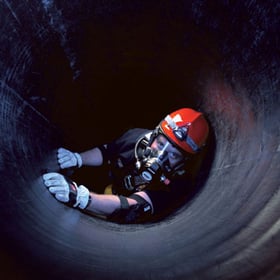
At some point during just about every Roco CSRT Rescue Stand-By job, someone will ask us why we are there. After we tell them that we’re there to make sure all the workers go home safely (and explain some of the basic requirements of OSHA’s 1910.146 regulation), they will normally add, “Well, we’re glad you’re here!”When asked how often we have to do a rescue, we’ll tell them that it’s not often – because our goal is to make sure a rescue never has to happen. With careful pre-planning and proper entry procedures, an entry rescue should not be needed.
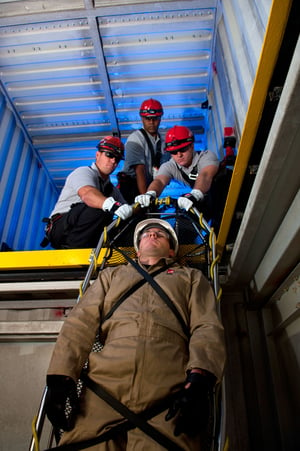
As we all know, however, things go wrong – especially in a confined space. And that’s when a Stand-by Rescue Team can make all the difference in the world – especially to the worker(s) in the hole.
With a facility that plans for confined space entry and routinely follows all safety precautions, employees just might not realize how common these confined space emergencies can be. With that in mind, we decided to do some very basic analyses of statistics from the Department of Labor. In looking at permit-required confined space incidents from 2005 through 2009, we found some of these statistics to be surprising.
Here’s what we found… during the 5-year period (2005-2009), there were a total of 481 fatalities. This averages to about 96.2 fatalities per year (or 1.85 fatalities per week). If you carry this logic forward, it equates to 1 fatality about every 4 days. And keep in mind that this data only covers incidents with at least one fatality or death, so these numbers don’t include all of those incidents that resulted in serious injuries or illnesses.
 These fatalities occurred in 28 states…with just about every age group other than the very young and the very old equally represented. Over 61% (or 298) of these incidents occurred during construction, repairing or cleaning activities. For 203 of the fatalities, the victim worked in the construction industry regularly; however, 17% (or 83) of the victims were in management positions.
Over 61% of confined space entry fatalities occurred during construction, repairing or cleaning activities.
One of the most surprising statistics had to do with the causes of these fatalities. Generally, you would assume that the most common cause of confined space emergencies would be atmospheric hazards. However, during this particular period, that was not the case. The largest cause by a significant measure was “Physical Hazards.” This broad term encompasses a lot of territory including, “struck by”; “caught in”; “collapses”; and “falls.” Physical hazards accounted for 294 or 61% of the fatalities. Atmospheric hazards (including fires) accounted for 160 or 33% of the incidents.
These numbers serve to remind us how important proper safety precautions are when it comes to confined spaces. For emergency responders, atmospheric hazards are always on our minds – however, from this, we also must consider the many physical hazards that are often found in confined spaces – especially when construction or maintenance activities are in process.